
If you're tracking your business performance metrics by calendar month only, then you're missing out on some important subtlety. Here's an outline of the basic issues with some simple practical solutions.
Almost all businesses use calendar months for tracking and measuring performance. Accounts are reported monthly. Invoices are paid monthly. Targets are set monthly. Months have become the default. So what's the problem?
Well first of all they're all different lengths. One of them isn't even the same length every year :-) They have different numbers of weekdays and weekends and if you're tracking any kind of activity that involves humans, you need to take this into account.
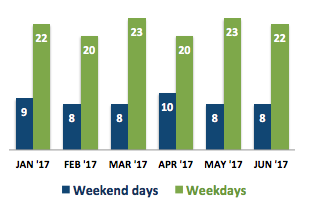
For instance, March 2017 has 3 more weekdays that February and April. That's 15% more weekdays! For tracking a weekday activity like, for instance, sales calls, this is a big difference. April has 25% more weekend days than most other months! That's super relevant if your customers are more engaged at weekends.
Another issue is that a month is simply too long to wait to see how your business is doing. You ideally need to be monitoring key metrics every day and predicting how your month will end up rather than just reporting retrospectively at the end of the month.
You probably won't change the basic calendar month reporting for your business but you can track and report activities slightly differently for different purposes. Especially for ongoing daily monitoring, there are some simple solutions here that I've been using for around 10 years and keep coming back to.
I'm assuming here that your data is in a database of some description, and you're extracting into a spreadsheet and/or reporting app. I'm also assuming that you're not an analyst, but just want some regular visibility of real-time metrics in your business.
tracking weekly data
If you're looking at live or recent data and want up to the minute tracking you may want to look at days and weeks. Looking at weeks helps to blend out very spikey data and gives you a slightly more distanced view than looking at individual days.
You can use a rolling average, it's a built in option in charts usually, but you may find it will over-blend your data and it can be hard to understand what is actually happening. I avoid inbuilt rolling averages generally.
There is also a spreadsheeet and DB function that gives you the weeknumber of any date. Weeks run Sunday to Saturday. This is ok for looking back at historical data but if you want to see every day how the current "week" or last 7 days is performing, you need to build your own functions to group your dates to your own specifications.
(I'll just point out here that I'm a bit of a purist where formulas and functions are concerned. You never modify data on the fly (the horror!), and ideally you want a function you can use again and again by dropping in new data. So everything is agnostic of the actual date it is today.)
So let's say you want to look at the last 7 days compared with previous 7 day groupings. Here is a formula that scores 9/10 * on my Formula Elegance Score :-) This formula goes into a new column for every record in your file. It's here in an Excel spreadsheet - other spreadsheet applications are available :-). If you're working in SQL I'm assuming you can figure out how to do the equivalent there but if not, sure just ask.
Date of original data + MOD(Most recent date - Date of original data,7)
You can see it in practice in the example below, with the actual formula and also the "wordy" description of what's happening. I've included the "Actual weeknum" just for reference.

Remember to make it really clear in your reporting what exactly this new field/column is. People won't immediately get their head around what you've done - never be afraid to add as much detail as you need to make people understand your data. If you use a heading like "7 days ending dd/mm/yy" for your new field it should be clear.
Tracking monthly data
If you are attached to monthly metrics, try using a 28 day grouping of days! This gives you an equal number of days, and crucially the same number of weeks, and weekdays and weekends in each month. It's also remarkably close in length to an actual month :-) It's a great way to monitor a month's worth of activity, comparing with previous "months"without having to wrestle with the calendar months' limitations. You also don't have to wait a full month before you can see where you are.
You can use a version of the formula above, just replace the 7 with 28 to get a new date formula which you can group/summarise for similar 28 day groupings.
Once you've nailed the basics...
Well now you can put in 7 day and 28 day averages and all sorts of specific calculations that are of benefit in your business. You can drop in new data without having to rebuild your reporting file. You can update your reporting every day if you like. Why not show off!
Have a go and do let me know how you get on. I'm always happy to help or answer any questions.
* Why did I only give my formula a 9/10? Anyone?